


The U.S. housing market, which cooled off in 2023 after a pandemic boom, is showing signs of a revival. The median home sale price grew 5.3% year-over-year in March 2024, and homes are selling more quickly—the share of homes sold in under two weeks is up 1.3 percentage points during the same period. This uptick in activity suggests a potential return to growth, incentivizing builders to seek permits for new construction, which could help alleviate the inventory shortage that has plagued the country for years.
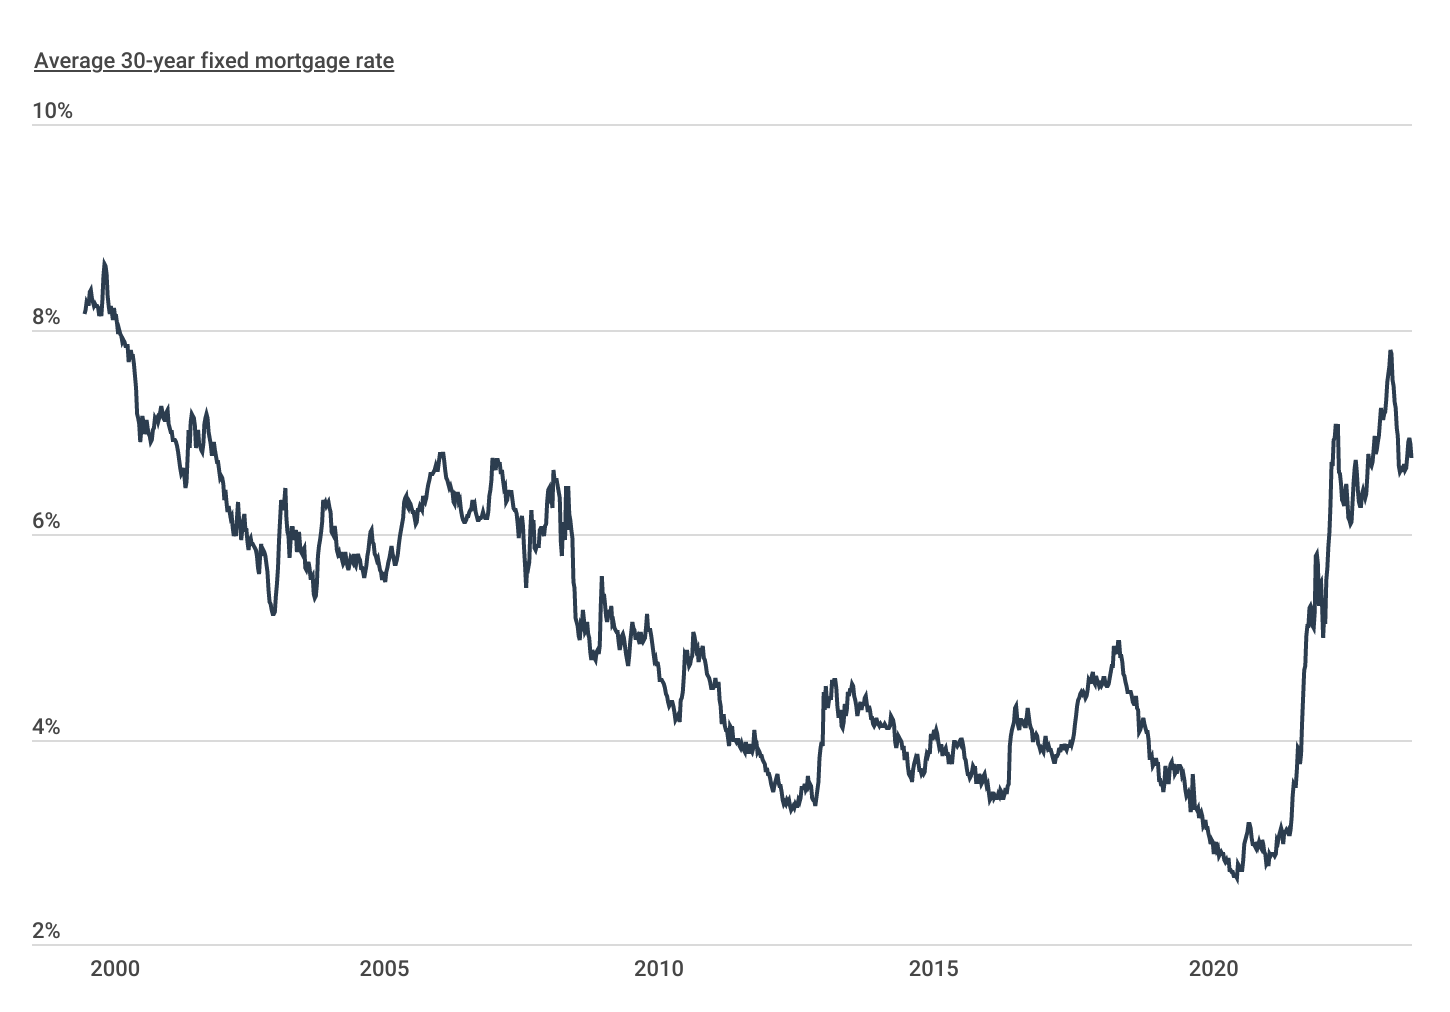
30-Year Fixed Mortgage Rates
Mortgage interest rates remain elevated, making borrowing more expensive than pre-COVID
Source: Construction Coverage analysis of Freddie Mac data | Image Credit: Construction Coverage
Over the past few years, interest rates have stood out as a key determinant affecting both buyer and builder confidence in the housing market. As the Federal Reserve rapidly increased rates during 2022 and 2023 to curb inflation, average 30-year fixed mortgage rates climbed to levels not seen in over two decades, reaching a peak of 7.79% in October 2023. Consequently, this period witnessed notable declines in transaction volume, prices, and builder confidence. However, since the peak in fall 2023, mortgage rates have gradually declined, contributing to a modest resurgence of buyer and builder activity in the market.
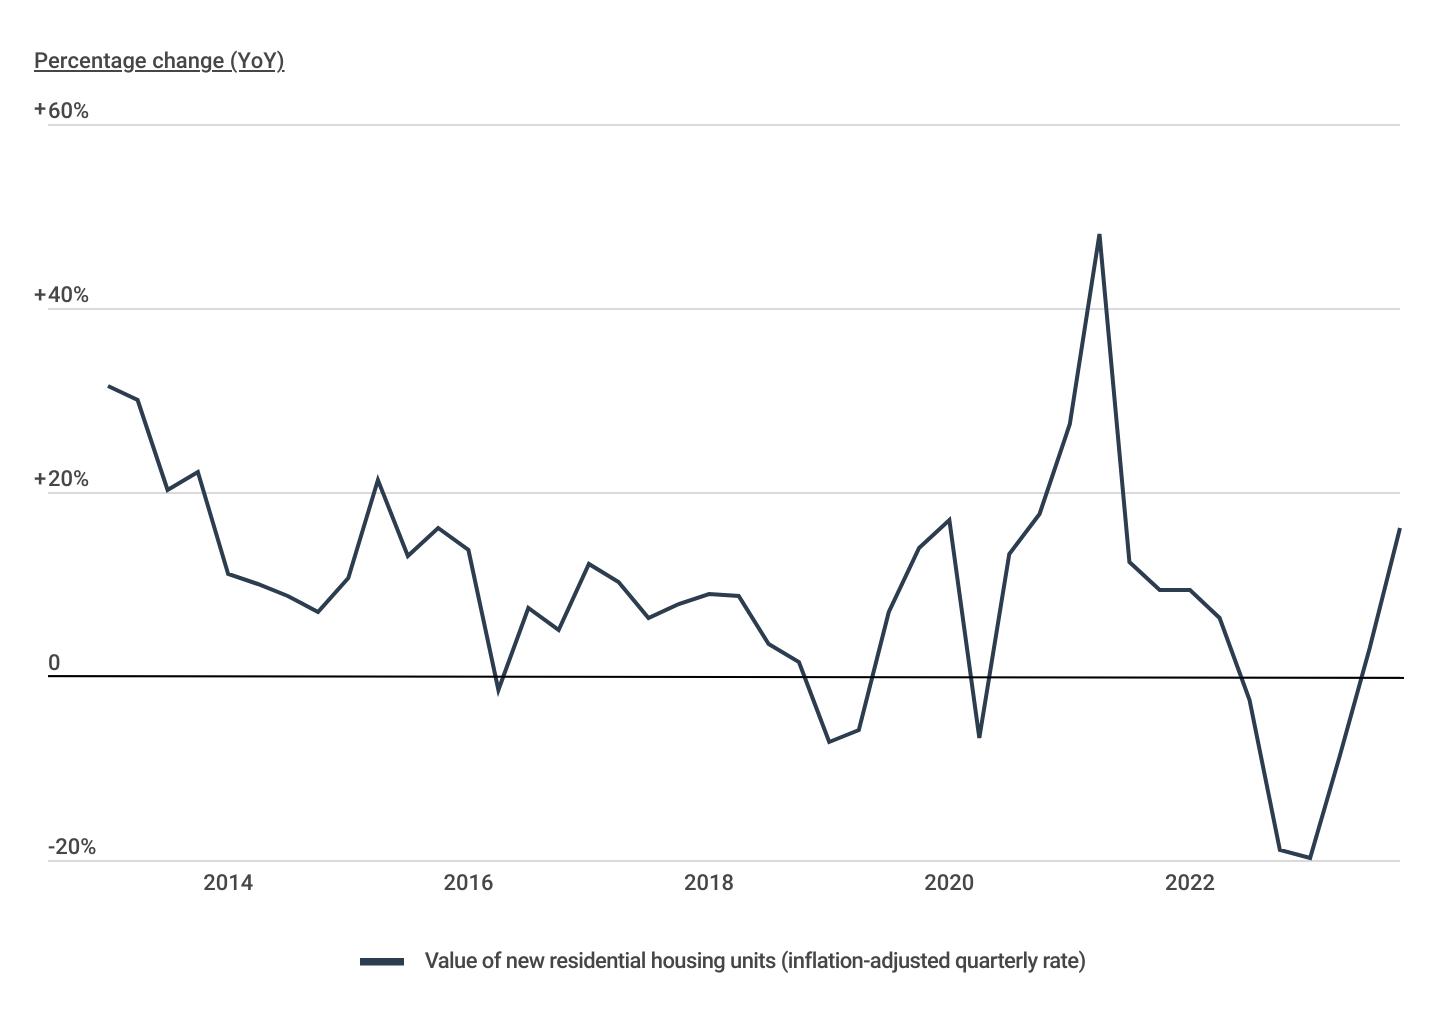
Changes in New Residential Home Construction
Despite persistently high interest rates, home construction permits are showing signs of growth
Source: Construction Coverage analysis of U.S. Census Bureau data | Image Credit: Construction Coverage
These trends are reflected in residential construction activity—specifically the total value of new housing projects authorized by building permits. After increasing by as much as 48% year-over-year in Q2 2021, residential construction projects began slowing down, bottoming out at a 20% year-over-year decline in early 2023. But, according to the National Association of Home Builders, the recent combination of pent-up demand, moderating interest rates, and a persistent shortage of inventory has helped accelerate building activity.
Residential housing construction ended 2023 on a high note, with authorized permit value increasing 3.1% in Q3 and 16% in Q4 from the same periods the year prior. And with the Fed projected to cut rates three times by the end of the year, sustained construction growth may be in store.
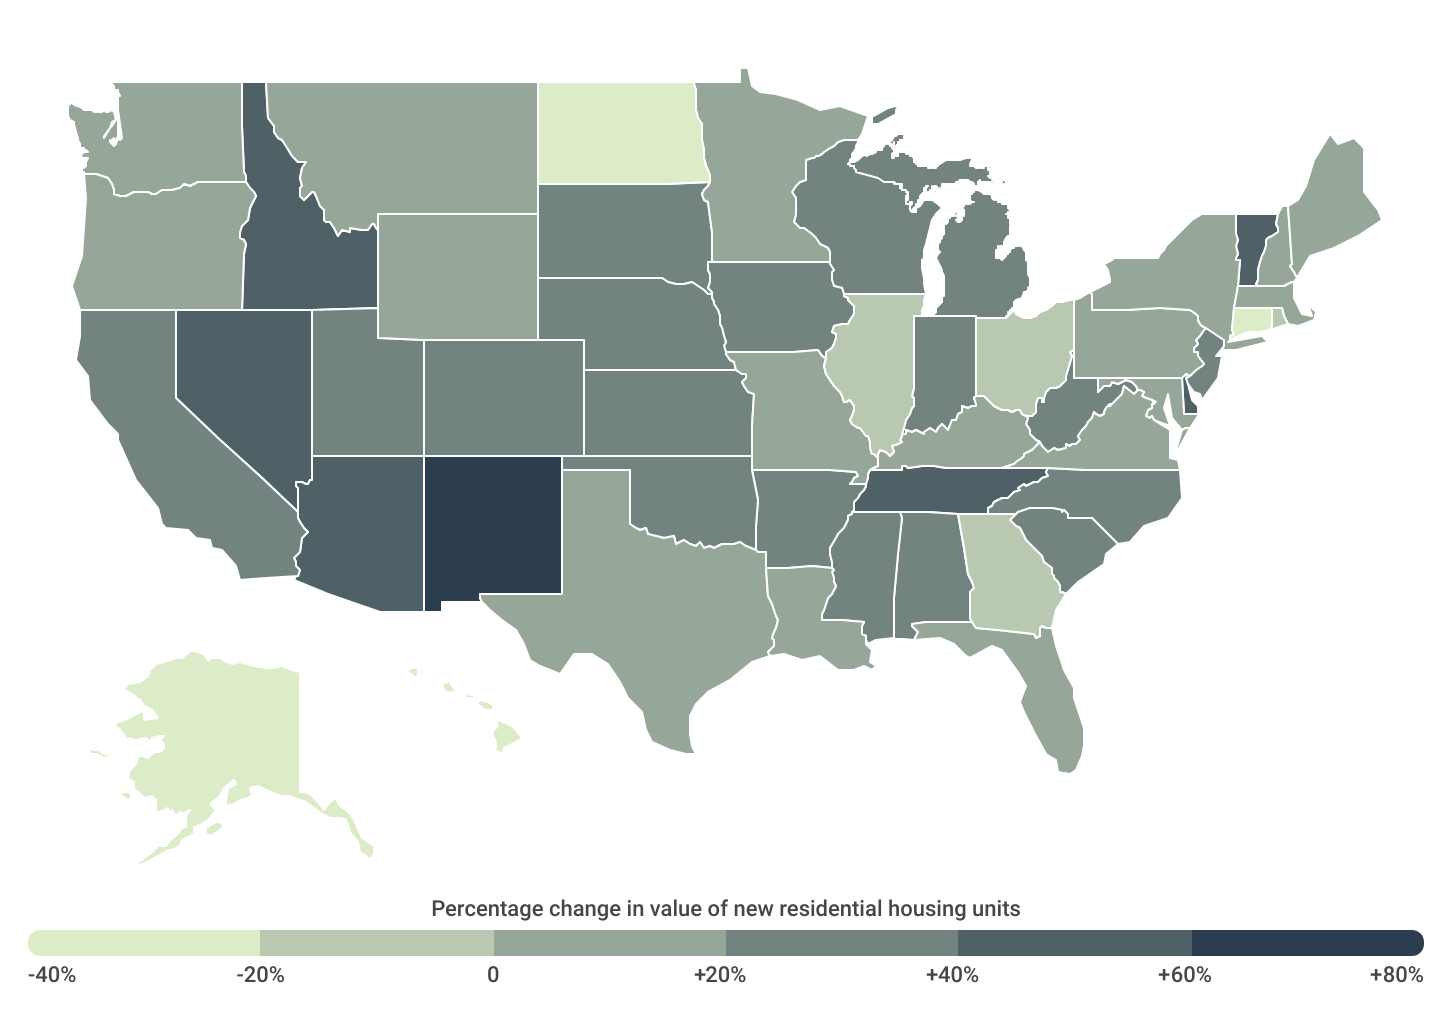
Geographical Differences in New Residential Home Construction
Southwestern states experienced the biggest increase in home construction
Source: Construction Coverage analysis of U.S. Census Bureau data | Image Credit: Construction Coverage
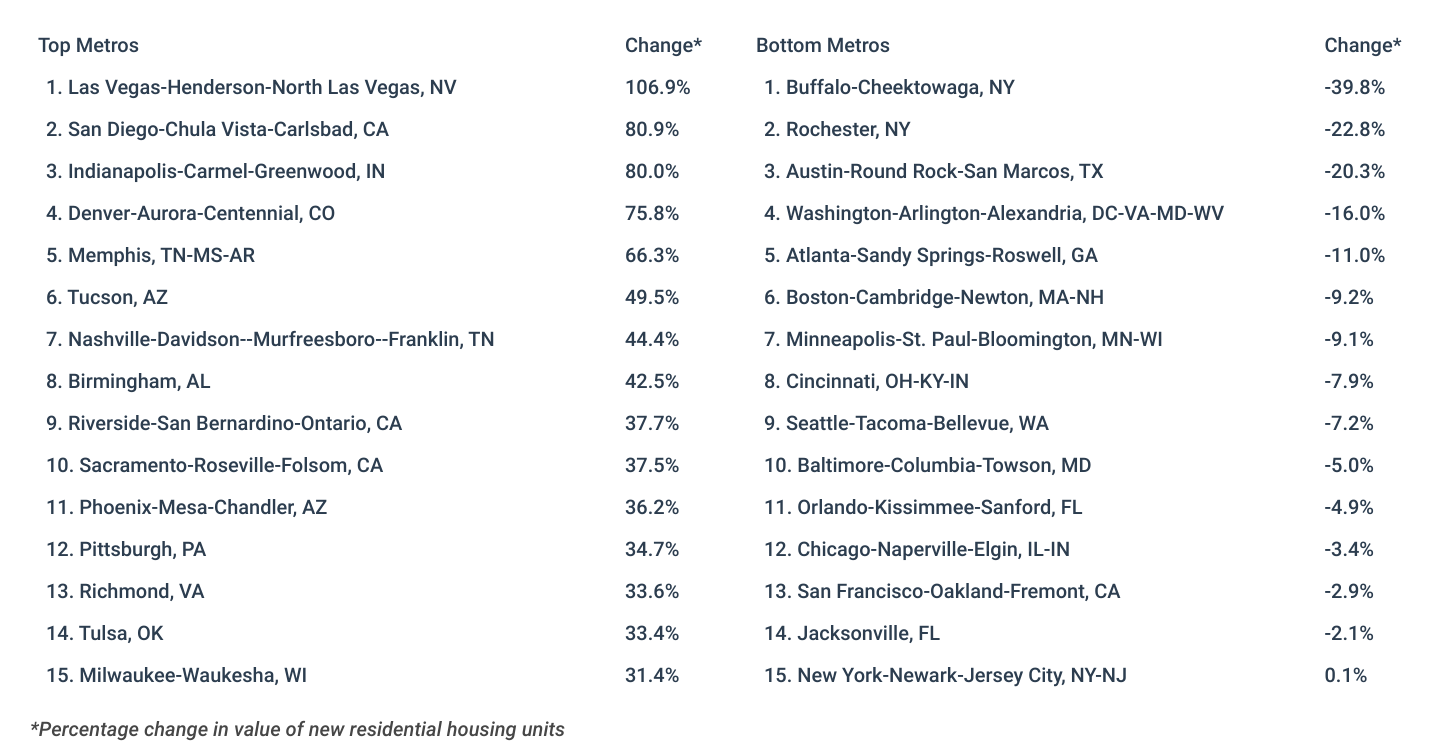
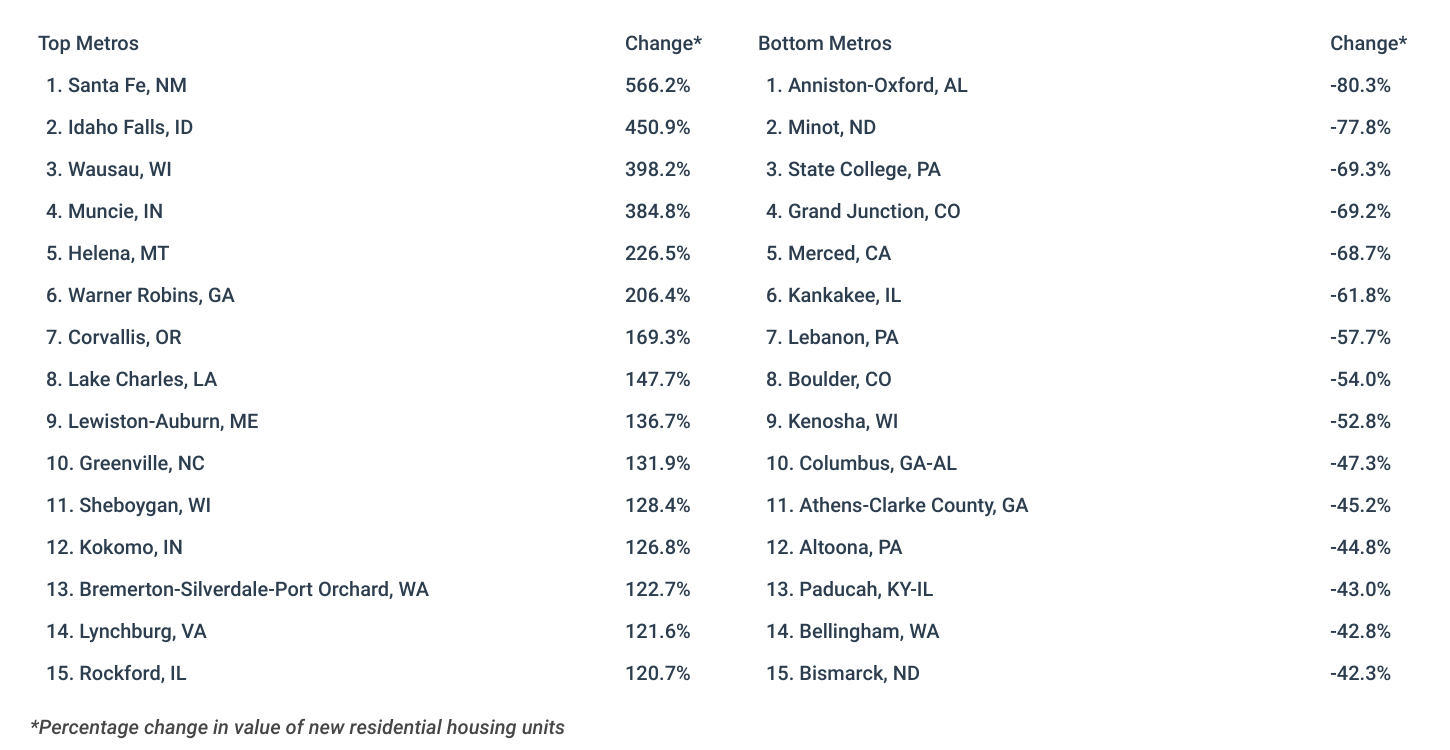
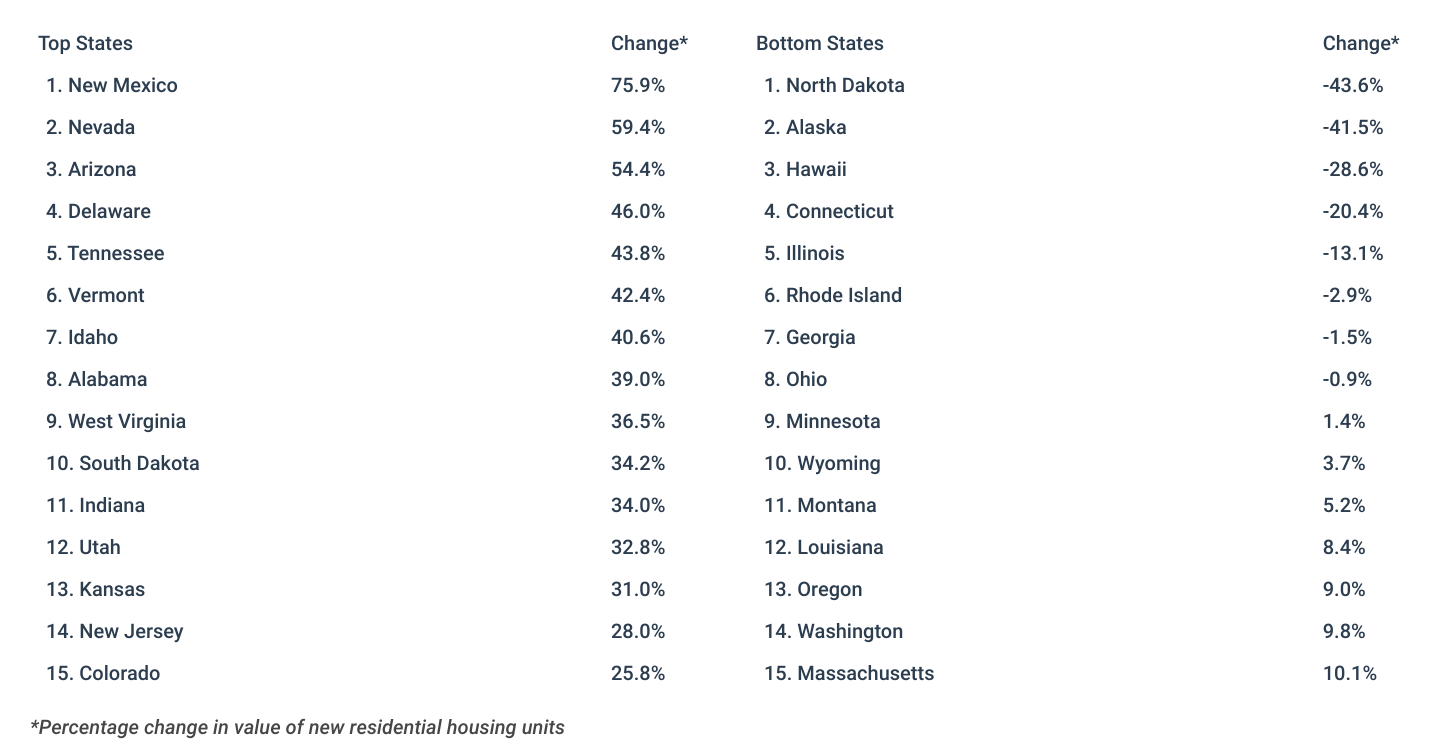
Some locations, however, are investing more in new residential construction than others compared to the same time last year. Areas in the Desert Southwest—who typically have more affordable home prices than some neighboring areas—saw the biggest increase in residential housing permit value from Q4 2023 to the year prior. New Mexico led all states with a 75.9% permit value increase, while Nevada and Arizona were the only other states to see increases greater than 50%. The same holds true at the metropolitan level where Las Vegas, NV led all large metros with a 106.9% increase year-over-year, and Santa Fe, NM led all small metros with a staggering 566.2% increase.
Below is a breakdown of changes in home construction for over 370 metros and all 50 states. The analysis was conducted by Construction Coverage, a website that compares construction software and insurance, using data from the U.S. Census Bureau. For more detailed information, refer to the methodology section.
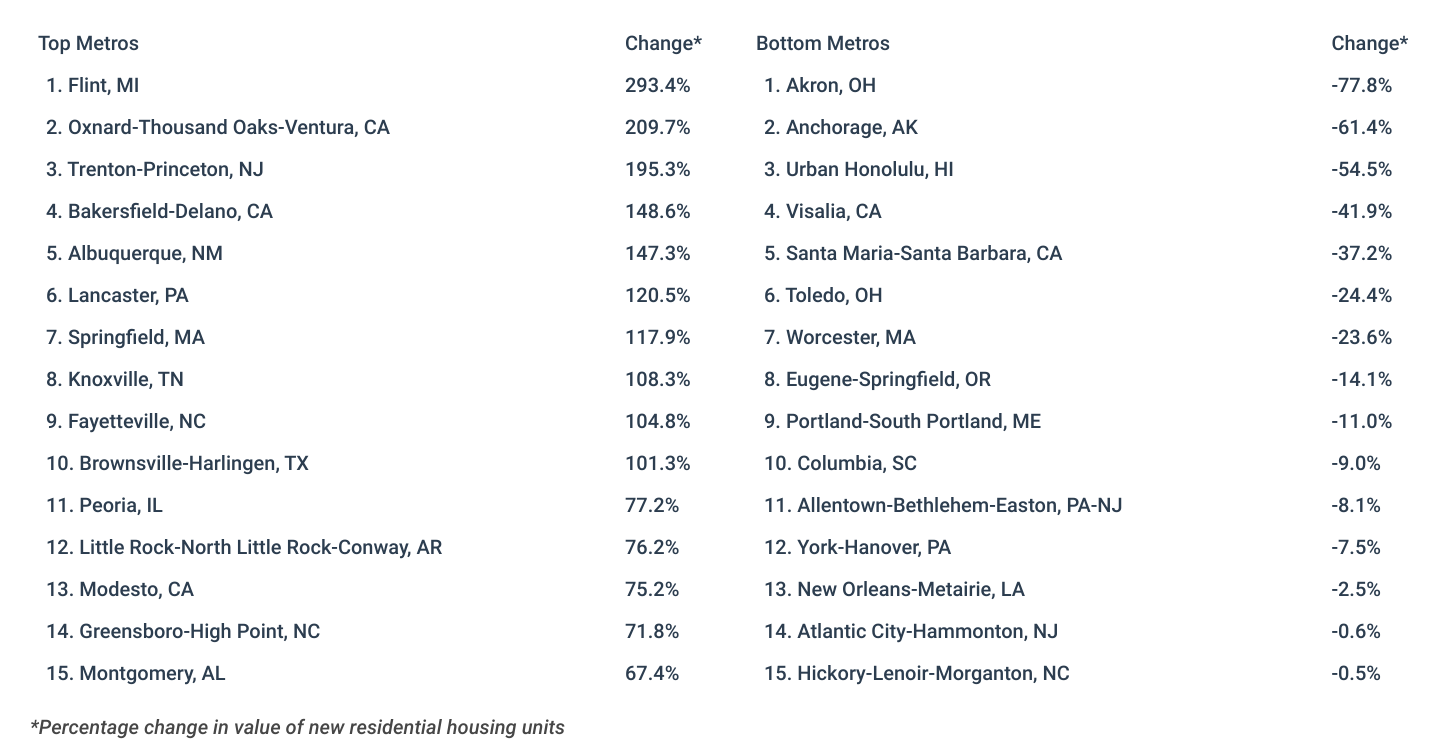
Large Metros With the Biggest Change in Home Construction
Midsize Metros With the Biggest Change in Home Construction
Small Metros With the Biggest Change in Home Construction
States With the Biggest Change in Home Construction
Methodology

Photo Credit: Jessica Kirsh / Shutterstock
The data used in this analysis is from the U.S. Census Bureau’s Building Permits Survey. To find the locations with the biggest increase in home construction, researchers at Construction Coverage calculated the percentage change in value of new residential housing units authorized by permit-issuing places from Q4 2022 to Q4 2023. In the event of a tie, the location with the bigger increase in total value of new residential housing units was ranked higher. The researchers also calculated the percentage change and total change in newly authorized residential housing units. For relevance, only metropolitan areas with complete data were included and those with less than 10 permits issued in Q4 2022 were omitted from the analysis. Additionally, metros were grouped into cohorts based on population size: small (less than 350,000), midsize (350,000–1,000,000), and large (more than 1,000,000).
For complete results, see Cities With the Biggest Year-Over-Year Increase in Residential Construction on Construction Coverage.